KYC / KYB Analysis
ℹ️ Important Information
🌟 Preface
As stated, this project aims to present a sample of the kind of project I completed during my time at MANGOPAY. Here, the tool used is Looker Studio, a free version of Looker with fewer features than the Enterprise version.
🎯 Objective
This dashboard aims to monitor the performance of the KYC / KYB process and identify improvement levers for the customer experience. It provides real-time visualization of key KPIs for client user onboarding, such as processing, rejection, or completion times, in order to optimize operational efficiency and regulatory compliance. It also delivers insights to reduce user friction, personalize user journeys, and improve conversion in fintech services.
🗂️ Context
Here, we simulate the KYC / KYB validation feature for individuals or legal entities of a platform (client) using a payment solution API.
📊 Dashboard Content
Dashboard Link: Dashboard KYC/KYB Analysis
- This dashboard contains 2 tabs: General KPIs on the KYC/KYB document submission and processing process (Key Performance Indicators Overview), and information about document processing times (Processing Time Analysis).
- Data source: This is a CSV file generated from scratch with fictional data, following the document submission logic (KYC or KYB) for an application using an API. Data covers January to June 2025.
- Filters: Includes filters for document creation date, client (platform) name, and user type (Natural or Legal).
📈 Key Performance Indicators Overview
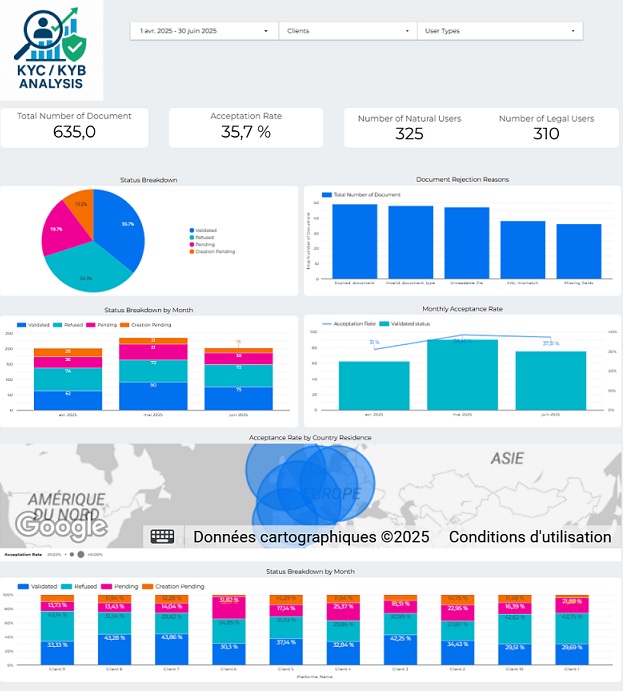
- Displays the overall KYC/KYB process: number of documents submitted, acceptance rate, and user distribution (Natural or Legal).
- Enables real-time monitoring of user onboarding for compliance and operational efficiency.
- Used to quickly detect bottlenecks or frictions in the onboarding journey.
These indicators present a global overview of the KYC/KYB process, showing total number of documents submitted, acceptance rate, and the breakdown between Natural and Legal users.
- Global, instant vision of the KYC/KYB process
- Monitor efficiency and processed volumes
- Clear distribution of user types
- Enables quick decision-making
The volume of cases is balanced between individuals and companies, but the acceptance rate of 35.7% reveals improvement potential (file quality, user education, process simplification...).

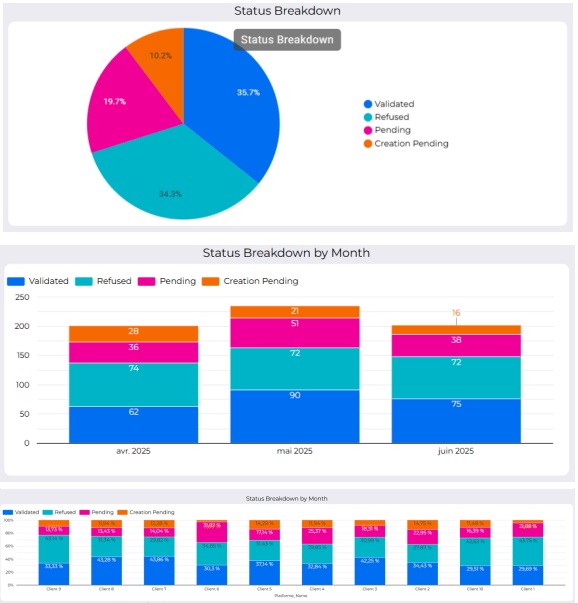
These visuals show the breakdown of documents by status, representing the processing step:
- Validated: Document processed and accepted
- Refused: Document processed and refused
- Pending: Document waiting for processing
- Creation pending: Document in creation
- Quick view of KYC/KYB statuses
- Monitor monthly changes
- Immediate identification of improvement points
- Target support or improvement actions by client
The proportion of validated files (35.7%) is close to refused (34.3%), indicating a high rejection rate. Nearly 30% are pending or in creation, signaling possible delays or bottlenecks. Monthly trends show a temporary improvement, but refusals remain numerous. Client analysis reveals significant disparities: some exceed 40% validated files, while others accumulate more refusals or pending statuses.
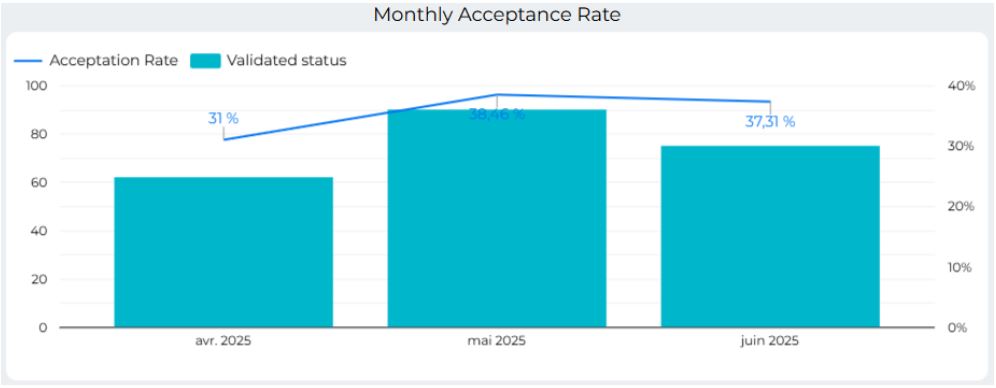
This graph combines monthly validations and acceptance rate, making it easy to track process dynamics.
- Precise monitoring of acceptance rate evolution over time
- Quick identification of monthly performance changes
- Helps measure the impact of improvement actions
The acceptance rate increases from 31% in April to 38.4% in May, then stabilizes at 37.3% in June. This suggests process improvement, but there is still room for progress.
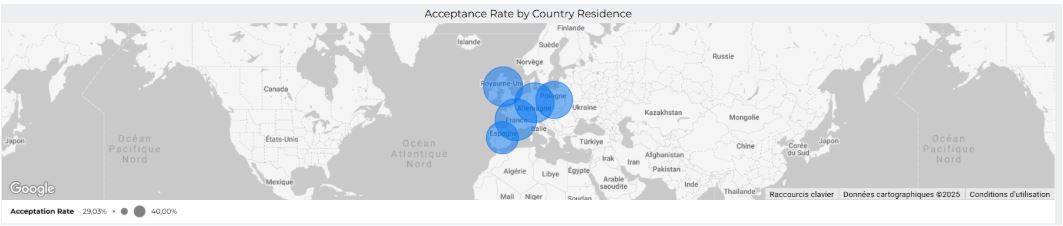
This view shows the geographical breakdown of KYC/KYB acceptance rates by country of residence, making it easy to spot performance differences and target improvement actions where rates are lowest.
- Clear visualization of acceptance rates by country
- Quickly identify countries with process challenges
- Target corrective/support actions by region
Acceptance rate varies significantly by country, with notable differences. Some countries are below 30%, signaling specific issues (documents, procedures, client expectations...) that should be analyzed and prioritized for international performance.
⏱️ Processing Time Analysis
- Compares average user submission time and internal processing time.
- Includes a 36-hour SLA limit with conditional formatting if exceeded.
- Highlights whether delays come from the internal process or the user side.
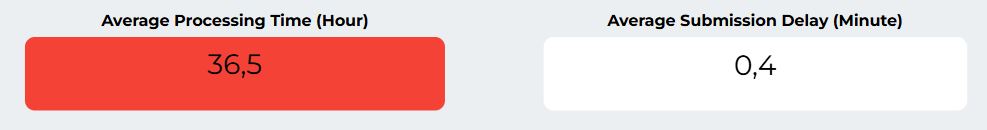
This visual compares average user submission time and internal processing time. Note: a 36-hour processing SLA is included. Conditional formatting is applied if the limit is exceeded to alert on non-compliance.
- Clear insight into process speed or slowness
- Instantly see if delays come from processing or from users
- Helps prioritize improvement efforts
Average user submission time is normal but could be improved (0.4 min), while average processing time is very high (36.5 hours), showing the main latency comes from internal process, not from users.
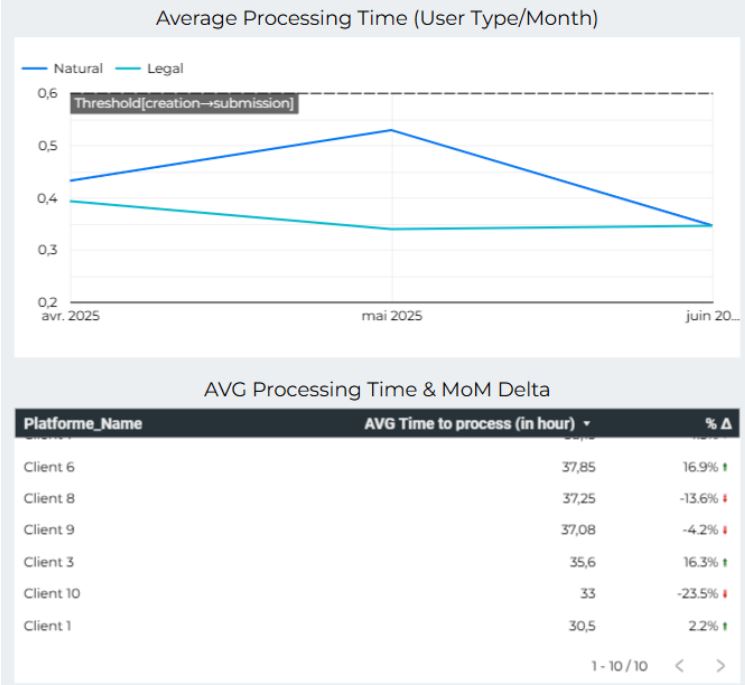
These visuals show the evolution of processing time by user type, plus a table for each client showing average processing time and its monthly delta, making operational management and SLA monitoring easier.
- Clear tracking by user type and month
- Immediate spotting of highest or improving delays
- Follow SLA compliance and quickly detect deviations
Processing time varies by client and month: some clients exceed the 36h SLA, while others show clear improvement. “Legal” users are generally processed faster than “Natural” users, except rare exceptions.
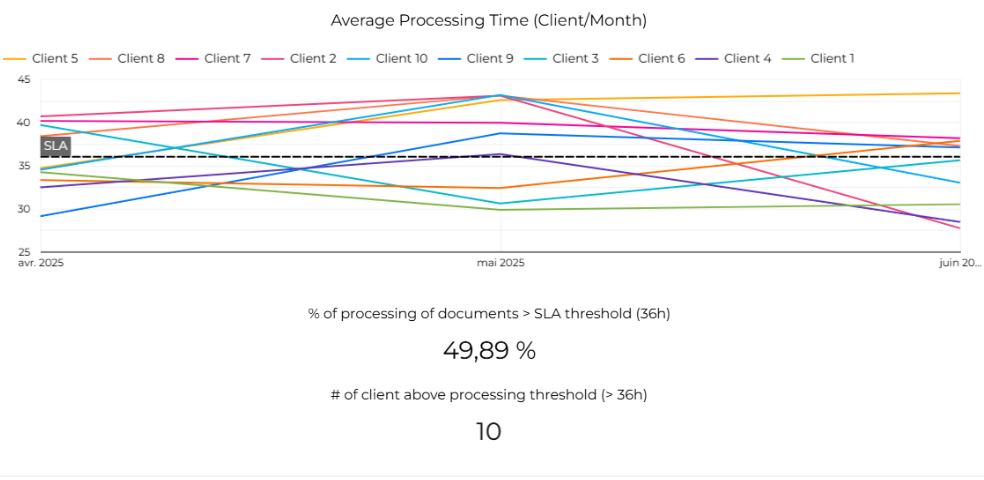
This visual shows average processing time per client/month with an SLA limit at 36h. Below, indicators display the % and number of clients above this threshold, allowing rapid targeting for SLA improvement.
- Instant visualization of SLA compliance for each client
- Quickly identify clients/periods exceeding SLA
- Monitor % and number of clients above SLA
Nearly half of all processing (49.89%) exceeds the 36-hour SLA, and all clients are affected at least once, showing generalized difficulty in meeting deadlines.
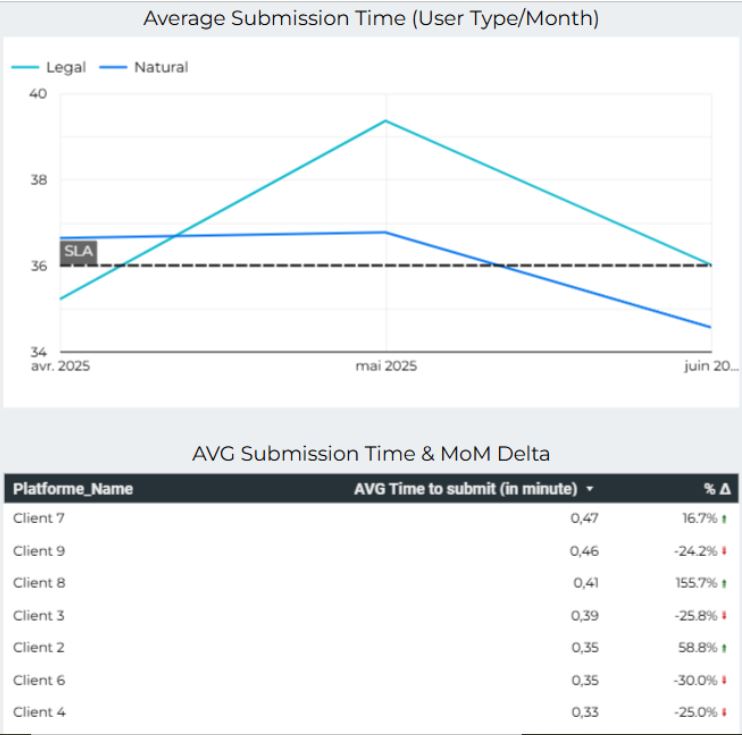
These visuals combine a chart of average submission time by user type over several months and a table per client with mean submission time and its monthly delta. The goal is a full view of trends and detailed client/platform performance.
- Direct comparison between clients and user segments
- Highlights those exceeding SLA limit
- Facilitates detection of progress or drift via the monthly delta
- Concrete support for targeting process improvements
Some clients are far above the 36h limit, while others show continuous improvement. “Legal” users are generally processed faster than “Natural” users. The delta highlights improvements and priorities.
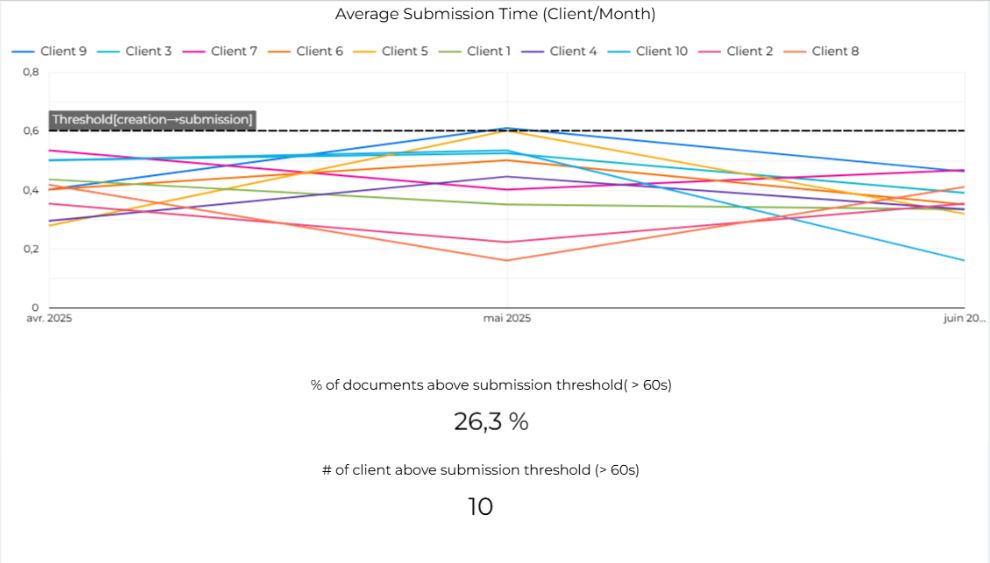
This chart shows average submission time per client/month, compared to a 60s threshold. Indicators below show the % and number of clients above this, allowing monitoring of user-side completion speed.
- Easy comparison between clients' submission performance
- Highlights clients or times with user reactivity below expectations
- Immediate indicator for support or UX improvement
- Track achievement of smooth onboarding goals
About a quarter of documents (26.3%) are above the 60s threshold, all clients concerned at least once. Overall user speed is good, but there are possible improvement areas.
✅ Overall Conclusion
The simulation shows that user submission time could be improved, but the main levers of optimization mainly concern reducing processing time and improving KYC/KYB processes, which will in turn benefit conversion and compliance.
- Acceleration of client onboarding: Faster KYC/KYB validation allows client platforms to activate their users more quickly, increasing their own business volume via the payment API.
- Reduction of operational costs: Precisely targeting friction points prevents resource waste and improves the productivity of support or compliance teams.
- Decrease in abandonment rate: By reducing delays and unjustified refusals, the conversion rate is maximized, which directly impacts clients’ revenue growth.
- Increased commercial attractiveness: An API that guarantees a fast and reliable KYC/KYB process becomes a major differentiator for attracting new partner platforms.
- Reduction of non-compliance risks: Proactive monitoring of SLAs and rejection rates helps avoid penalties and strengthens trust with regulators and partners.
- Detailed analysis of KYC/KYB rejection or failure reasons (by client and user type), to guide improvements in document collection and the user experience.
- Onboarding conversion funnel monitoring: Visualize every process step, from creation to validation, to identify drop-off points.
- Analysis of the financial cost of delays or failures: Estimate the business impact (lost revenue, support costs, etc.) due to files not validated on time.
- Correlation between processing time and user activation/retention: Quantify the effect of faster validation on user activation rate and API usage recurrence.