Client Acquisition & Onboarding Dashboard (Salesforce Simulation)
ℹ️ Important Information
🌟 Preface
This project illustrates a typical mission I carried out at MANGOPAY, using Salesforce Developer, a free and limited version of Salesforce. The structure here is deliberately simplified for demonstration; in reality, I worked on much more complex and advanced Salesforce environments.
🎯 Objective
The goal is to have an acquisition tracking dashboard, allowing real-time visualization of the client journey, key steps, and all essential information (platform status, milestone dates, delays, first revenues, etc.), from contract signature through to go-live and client stabilization.
🗂️ Context
The project involved modeling and tracking the entire customer acquisition and onboarding journey within Salesforce, from commercial qualification to post-onboarding follow-up. To represent this cycle, I created Platform and Revenue objects, enhanced standard objects (Account, Opportunity), and managed their relationships, to build a synthetic dashboard for efficient activity management. This project highlights my ability to analyze business needs, structure data, and propose relevant models for operational management in Salesforce.
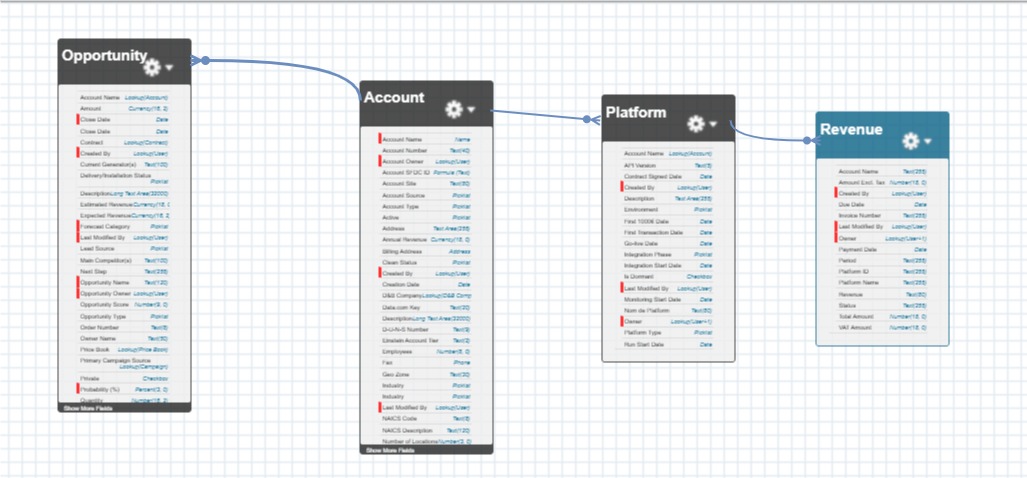
🛠️ Main Salesforce Objects
- Account: Represents each client/company.
- Opportunity: A commercial process for an account (can be several per account: new offers, renewals, etc.).
- Platform: Represents each technical integration (API, web/mobile environment, SaaS module, etc.) set up for a client (can be several per account).
- Revenue: Represents revenues or invoices generated per platform (custom object for demo purposes).
- One Account can have multiple Opportunities
- One Account can have multiple Platforms
- One Platform belongs to one Account and can have multiple Revenues
🔄 Key Lifecycle Information
- Acquisition steps (Opportunity): Qualification, Proposal, Signature, Integration Prep
- Integration phases (Platform): Kick-off, Configuration, Tests, Go-live, Monitoring, Run
- Milestone dates: Contract signature, integration start, go-live, run phase, etc.
- Status tracking: Account & Platform status
- Revenue tracking (Revenue): Amount, status, due and payment dates
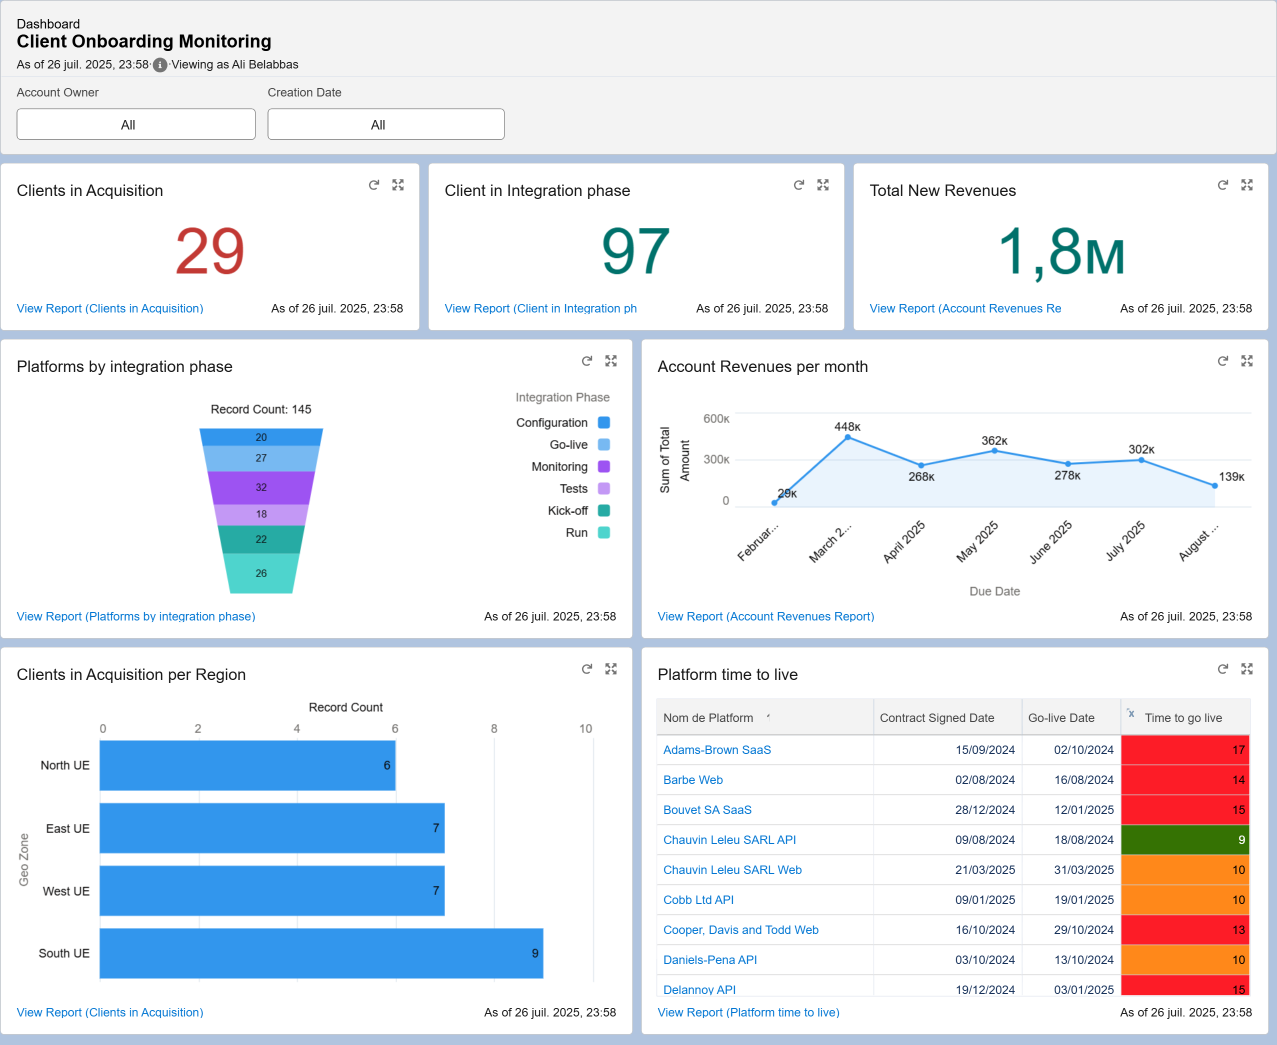
📊 Dashboard Content
- Tracking of client volume per phase (acquisition vs integration)
- Distribution of platforms by integration phase (from Kick-off to Run)
- Monthly revenue dynamics to analyze growth
- Geographic distribution of clients in acquisition (by European region)
- Monitoring integration delays (Time to go live) per platform, with visual highlights of gaps and potential delays
Each indicator is interactive, relying on custom Salesforce reports, providing a clear, actionable view for sales, operational, and management teams. This dashboard fosters early detection of bottlenecks, effective team management, and optimization of the client onboarding process.
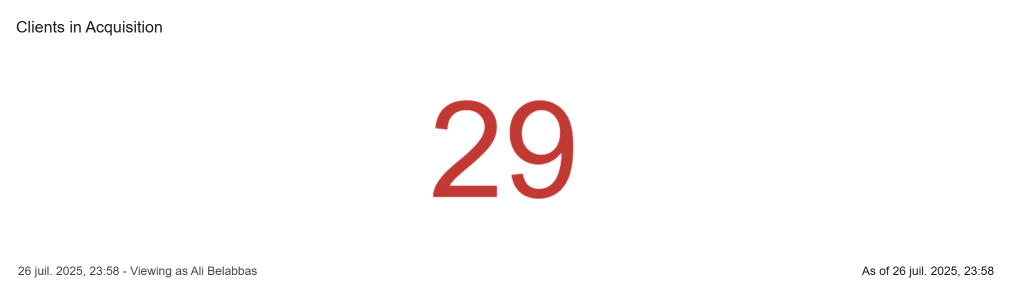
👥 Clients in Acquisition
Total number of clients currently in the commercial acquisition phase.
- Measures the volume of active opportunities and potential workload for Delivery/Tech teams.
With 29 clients in acquisition, the commercial pipeline is well supplied, suggesting a steady flow for upcoming phases.
🔌 Clients in Integration Phase
Total number of clients currently undergoing technical/project integration.
- Tracks the operational workload of Delivery/Tech teams and the overall portfolio progress.
97 clients are in the integration phase, reflecting a growing portfolio and the need for robust onboarding/support resources to avoid bottlenecks.

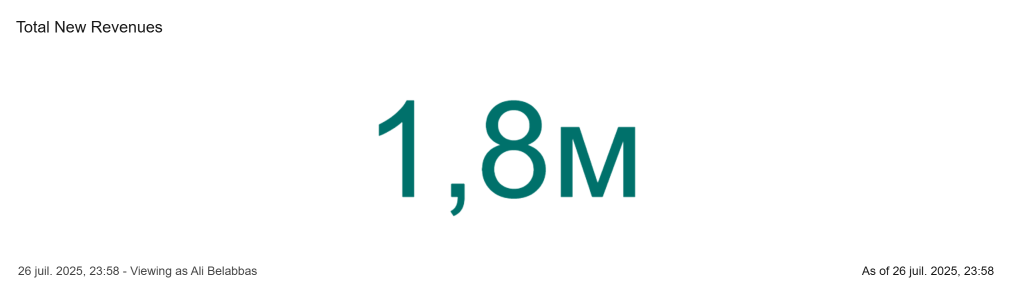
💶 Total New Revenues
Cumulative revenue generated by new clients or recently onboarded platforms.
- Provides a synthetic view of commercial performance as clients convert and onboard.
With €1.8M in new revenues, client conversion/onboarding is efficiently translating into real business.
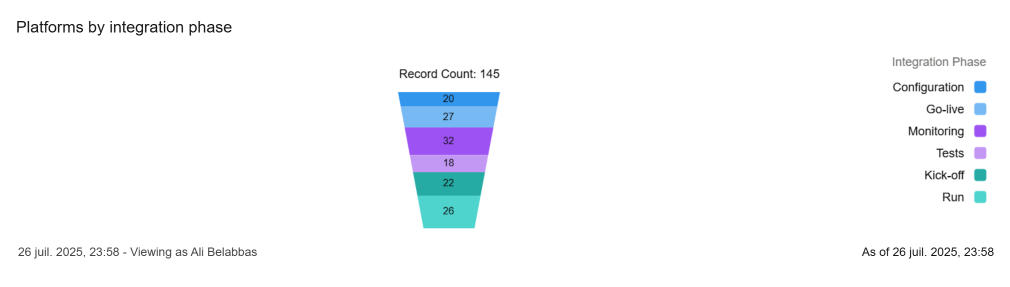
🛠️ Platforms by Integration Phase
Distribution of client platforms by their integration phase: Kick-off, Configuration, Tests, Go-live, Monitoring, Run.
- Quickly identify bottlenecks and prioritize actions to accelerate go-live.
Most platforms are in "Tests" and "Go-live", which may indicate an accumulation at these steps; close monitoring is advised to avoid production delays.
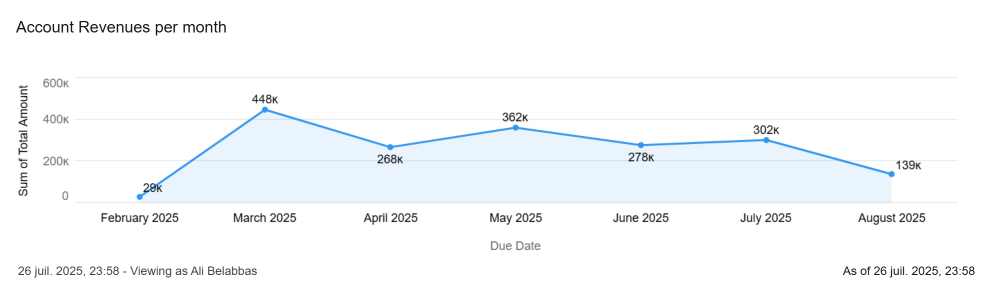
📆 Account Revenues per Month
Evolution of client account revenues, broken down by month (based on “Due Date”).
- Visualize seasonality and cash-inflow trends across the period.
Notable peak in March (€448k), with sustained revenue through May, then a slight drop—possibly due to seasonality or delays in some integrations.
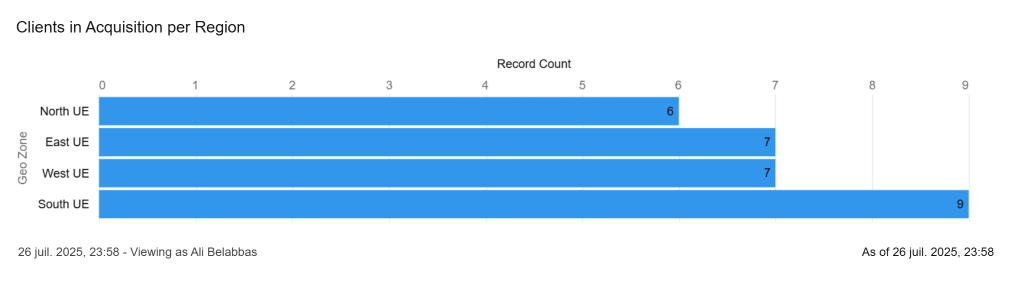
🌍 Clients in Acquisition per Region
Breakdown of clients in acquisition by European region (North, East, West, South EU).
- Helps identify the most dynamic regions or target specific commercial actions.
South EU has the largest number of clients in acquisition (9), indicating high growth potential or an active commercial strategy in this area.
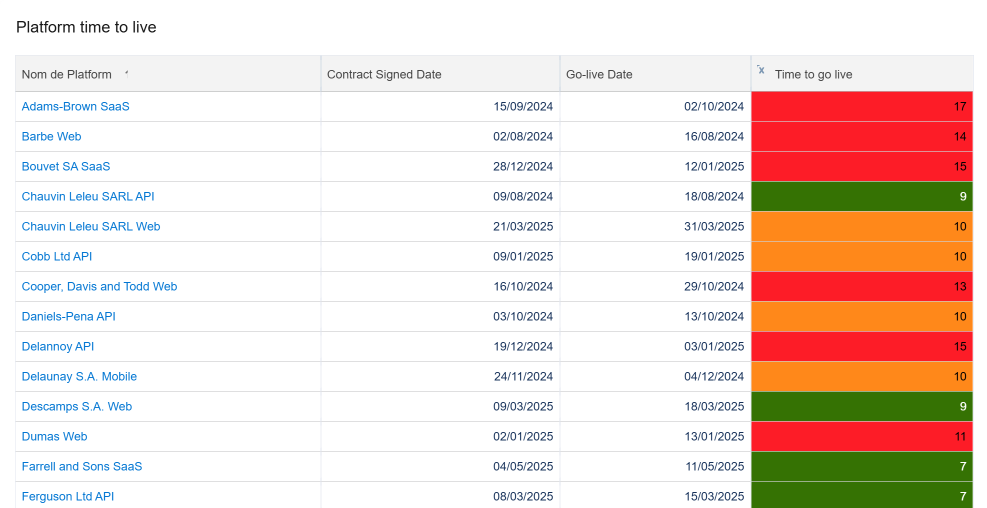
⏳ Platform Time to Live
Detailed table for each platform showing contract signature date, planned go-live date, and actual “Time to go live”, with color coding for critical delays.
- Prioritize at-risk platforms, identify integration delays, and act early to meet commitments.
Several platforms have a high “Time to go live” (highlighted in red/orange), signaling delays or complex integrations needing close attention.
✅ Overall Conclusion
This dashboard offers a clear and dynamic overview of the client acquisition and onboarding journey, from commercial phase to revenue generation. All indicators allow real-time tracking of client progress, anticipation of friction points, and fast identification of optimization levers at each lifecycle stage.
- Centralized tool for decision support
- Eases sales and operations team management
- Better anticipation of delays and bottlenecks
- Improves client follow-up and onboarding efficiency
- Accelerates time-to-revenue while securing client experience
- Cross-visualization (phases, regions, delays, revenue) helps target commercial actions and optimize resource allocation
- Deeper analysis of delay causes in critical integration phases (file quality, resources, technical complexity...)
- Set up automated alerts for at-risk cases (delays, deadlines exceeded...)
- Refine KPIs, e.g., by tracking post-onboarding client satisfaction or churn in the first months
- Automate reminders and tasks for teams based on steps or statuses
- Extend tracking to existing clients for portfolio monitoring, upsell/cross-sell rates, and post-integration support management